Essay
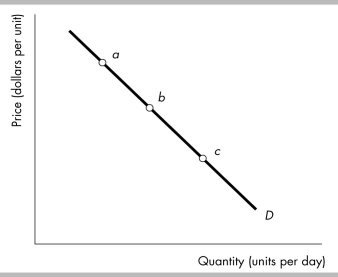
-In the figure above, at which point (a, b, or c) along the linear demand curve illustrated would demand be
a) most elastic?
b) most inelastic?
Correct Answer:

Verified
a) The demand would ...View Answer
Unlock this answer now
Get Access to more Verified Answers free of charge
Correct Answer:
Verified
View Answer
Unlock this answer now
Get Access to more Verified Answers free of charge
Q514: The quantity of new cars increases by
Q515: Marvin loves chocolate truffles. As the price
Q516: When the price of oranges increases from
Q517: <img src="https://d2lvgg3v3hfg70.cloudfront.net/TB8586/.jpg" alt=" -The table above
Q518: The price elasticity of demand _ in
Q520: Grape juice prices increased by 20 percent
Q521: A local pizzeria charges $10 for a
Q522: Suppose the quantity demanded is 5 units
Q523: If the percentage change in quantity demanded
Q524: Florida State University has just lowered the