Multiple Choice
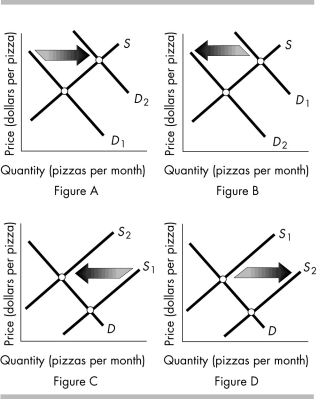
-The above figure shows the market for pizza. Which figure shows the effect of a new report by the U.S. Surgeon General that eating pizza lowers cholesterol levels, an outcome many people want?
A) Figure A
B) Figure B
C) Figure C
D) Figure D
Correct Answer:

Verified
Correct Answer:
Verified
Q201: <img src="https://d2lvgg3v3hfg70.cloudfront.net/TB8586/.jpg" alt=" -The above figures
Q202: Apples are a normal good, so if
Q203: If the quantity of textbooks supplied is
Q204: A decrease in the price of bowling
Q205: In 2014, the price of peanuts was
Q207: A recession occurs and people's incomes decrease.
Q208: Students can rent a Blu-ray movie at
Q209: <img src="https://d2lvgg3v3hfg70.cloudfront.net/TB8586/.jpg" alt=" -In the figure,
Q210: <img src="https://d2lvgg3v3hfg70.cloudfront.net/TB8586/.jpg" alt=" -In the above
Q211: What leads to a decrease in the