Multiple Choice
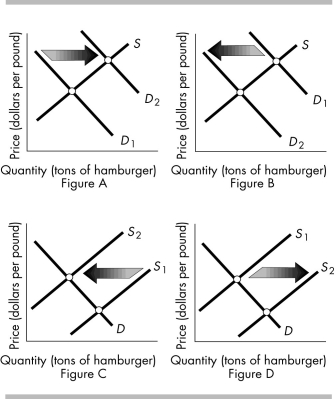
-The above figures show the market for hamburger meat. Which figure shows the effect when more farmers decide to raise cows that are processed into hamburger meat?
A) Figure A
B) Figure B
C) Figure C
D) Figure D
Correct Answer:

Verified
Correct Answer:
Verified
Related Questions
Q445: The supply curve indicates the minimum quantity
Q446: An increase in demand combined with no
Q447: During the mid-2000s, the average price of
Q448: Explain the difference between a change in
Q449: At prices above the equilibrium price, what
Q451: When the demand for blue jeans increases,
Q452: When the price is below the equilibrium
Q453: If the price of an Xbox player
Q454: The price of jet fuel falls. This
Q455: An economist says: "The supply curve has