Multiple Choice
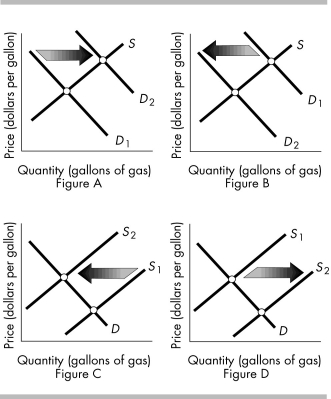
-The above figures show the market for gasoline. Which figure(s) shows the effect of a new U.S. tax on oil that suppliers must pay?
A) Figures A and C
B) Figures B and D
C) Figure A only
D) Figure C only
Correct Answer:

Verified
Correct Answer:
Verified
Related Questions
Q224: As the relative price of a good
Q225: Which of the following shifts the supply
Q226: <img src="https://d2lvgg3v3hfg70.cloudfront.net/TB8586/.jpg" alt=" -Suppose the market
Q227: The demand curve for a normal good
Q228: Which of the following always lowers the
Q230: What leads to a decrease in the
Q231: If the demand and supply curves are
Q232: When the price of a normal good
Q233: The observation that the demand curve for
Q234: If house purchases and renting an apartment