Multiple Choice
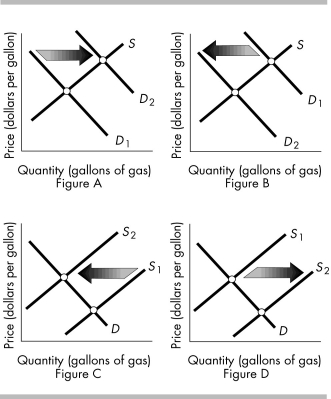
-The above figures show the market for gasoline. Which figure shows the effect of the end of a nine month strike by workers at all U.S. oil refineries?
A) Figure A
B) Figure B
C) Figure C
D) Figure D
Correct Answer:

Verified
Correct Answer:
Verified
Q196: The law of demand states that, other
Q197: <img src="https://d2lvgg3v3hfg70.cloudfront.net/TB8586/.jpg" alt=" -In the figure
Q198: <img src="https://d2lvgg3v3hfg70.cloudfront.net/TB8586/.jpg" alt=" -In the above
Q199: The supply curve slopes upward when graphed
Q200: Which of the following raises the price
Q202: Apples are a normal good, so if
Q203: If the quantity of textbooks supplied is
Q204: A decrease in the price of bowling
Q205: In 2014, the price of peanuts was
Q206: <img src="https://d2lvgg3v3hfg70.cloudfront.net/TB8586/.jpg" alt=" -The above figure