Multiple Choice
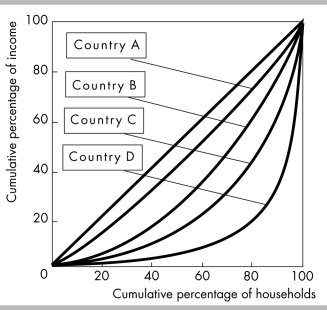
-The above figure shows the Lorenz curves for four different countries. Which of the following statements is FALSE?
A) Country A has an income distribution that is not perfectly equal.
B) Country D's income distribution is the most unequal of the four countries.
C) The distribution of income is more unequal in country A than in country B.
D) The distribution of income is more unequal in country D than in country C.
Correct Answer:

Verified
Correct Answer:
Verified
Q4: The Lorenz curve<br>A) explains why some households
Q5: A proportional income tax is defined as
Q6: <img src="https://d2lvgg3v3hfg70.cloudfront.net/TB8586/.jpg" alt=" -In the figure
Q7: <img src="https://d2lvgg3v3hfg70.cloudfront.net/TB8586/.jpg" alt=" -The above figure
Q8: A Lorenz curve measures<br>A) the benefits received
Q10: In the United States the richest 20
Q11: <img src="https://d2lvgg3v3hfg70.cloudfront.net/TB8586/.jpg" alt=" -The government in
Q12: For the United States, Lorenz curves show
Q13: <img src="https://d2lvgg3v3hfg70.cloudfront.net/TB8586/.jpg" alt=" -The above table
Q14: <img src="https://d2lvgg3v3hfg70.cloudfront.net/TB8586/.jpg" alt=" -The above figure