Multiple Choice
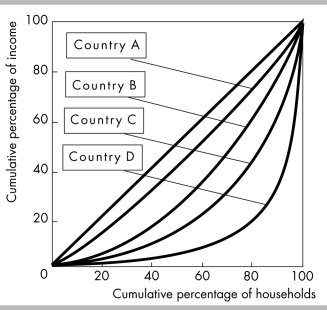
-The above figure shows the Lorenz curves for four different countries. Which of the following statements CAN be made on the basis of the graph?
A) Country C has the best balance between equity and efficiency.
B) Country A is a socialist country.
C) The income distribution is more equal in country B than in country D.
D) all of the above
Correct Answer:

Verified
Correct Answer:
Verified
Q153: The mean household income is<br>A) the income
Q154: How has income inequality changed in recent
Q155: <img src="https://d2lvgg3v3hfg70.cloudfront.net/TB8586/.jpg" alt=" -The table above
Q156: What is the main reason that the
Q157: _ is the single biggest factor affecting
Q159: Of the approximate total population of 300
Q160: Economists who have compared the incomes of
Q161: <img src="https://d2lvgg3v3hfg70.cloudfront.net/TB8586/.jpg" alt=" -In the figure
Q162: What do the Lorenz curves for wealth
Q163: As a tool that is used to