Multiple Choice
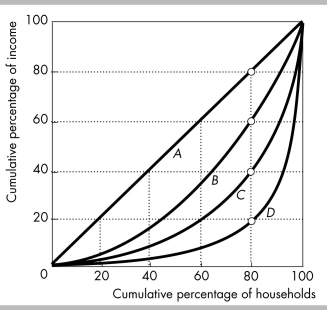
-In the figure above, the Lorenz curve that shows the richest 20 percent of households receiving 40 percent of all income is
A) curve A.
B) curve B.
C) curve C.
D) curve D.
Correct Answer:

Verified
Correct Answer:
Verified
Q198: <img src="https://d2lvgg3v3hfg70.cloudfront.net/TB8586/.jpg" alt=" -The above table
Q199: Measured wealth is a less accurate indicator
Q200: <img src="https://d2lvgg3v3hfg70.cloudfront.net/TB8586/.jpg" alt=" -In the figure
Q201: Mode income is<br>A) the most common income.<br>B)
Q202: If one person has all the income
Q204: High-skilled workers have<br>A) a lower value of
Q205: Pamela Michelle Scott, a low income single
Q206: Information technologies _ the demand for low-skilled
Q207: What is a Lorenz curve and what
Q208: <img src="https://d2lvgg3v3hfg70.cloudfront.net/TB8586/.jpg" alt=" -The above figure