Multiple Choice
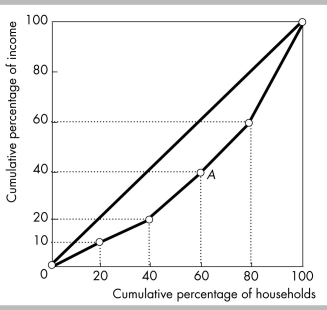
-In the figure above, the curve going through point A represents
A) an upward-sloping demand curve.
B) the line of equality.
C) the wage curve.
D) the Lorenz curve.
Correct Answer:

Verified
Correct Answer:
Verified
Q192: An income tax in which the average
Q193: <img src="https://d2lvgg3v3hfg70.cloudfront.net/TB8586/.jpg" alt=" -In the figure
Q194: Measured distributions of wealth that do NOT
Q195: The farther the Lorenz curve for income
Q196: Market income is<br>A) wage, interest, rent, and
Q198: <img src="https://d2lvgg3v3hfg70.cloudfront.net/TB8586/.jpg" alt=" -The above table
Q199: Measured wealth is a less accurate indicator
Q200: <img src="https://d2lvgg3v3hfg70.cloudfront.net/TB8586/.jpg" alt=" -In the figure
Q201: Mode income is<br>A) the most common income.<br>B)
Q202: If one person has all the income