Multiple Choice
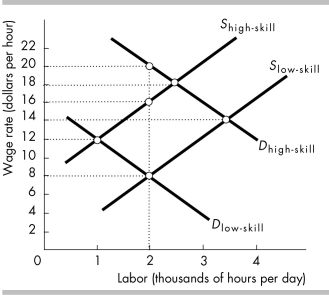
-The above figure shows the demand and supply curves for high-skilled and low-skilled labor. The wage differential between high-skilled and low-skilled labor is
A) $8.
B) $10.
C) $12.
D) $14.
Correct Answer:

Verified
Correct Answer:
Verified
Q88: <img src="https://d2lvgg3v3hfg70.cloudfront.net/TB8586/.jpg" alt=" -In the figure
Q89: Discrimination _ the group being discriminated against
Q90: In the United States, the wealthiest 10
Q91: Market income is defined as wages, interest,
Q92: The "big tradeoff" refers to the point
Q94: An income tax system in which the
Q95: The income that measures a household's earnings
Q96: <img src="https://d2lvgg3v3hfg70.cloudfront.net/TB8586/.jpg" alt=" -In the figure
Q97: Sue has human capital worth $500,000 and
Q98: <img src="https://d2lvgg3v3hfg70.cloudfront.net/TB8586/.jpg" alt=" -Using the table