Multiple Choice
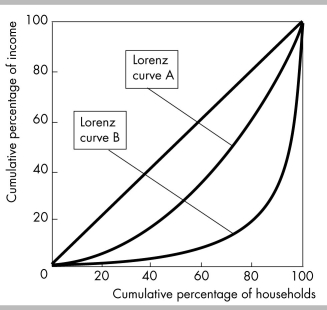
-The figure above shows two Lorenz curves, one before income redistribution and one after income redistribution. Lorenz curve B represents
A) market income.
B) money income.
C) money income before taxes.
D) income after taxes.
Correct Answer:

Verified
Correct Answer:
Verified
Q12: For the United States, Lorenz curves show
Q13: <img src="https://d2lvgg3v3hfg70.cloudfront.net/TB8586/.jpg" alt=" -The above table
Q14: <img src="https://d2lvgg3v3hfg70.cloudfront.net/TB8586/.jpg" alt=" -The above figure
Q15: <img src="https://d2lvgg3v3hfg70.cloudfront.net/TB8586/.jpg" alt=" -The above figure
Q16: <img src="https://d2lvgg3v3hfg70.cloudfront.net/TB8586/.jpg" alt=" -In the above
Q18: Because of assortative mating, wealth becomes _
Q19: If one person has all the income
Q20: From left to right, the horizontal axis
Q21: The distribution of U.S. income is NOT
Q22: "Over the past two decades, the distribution