Multiple Choice
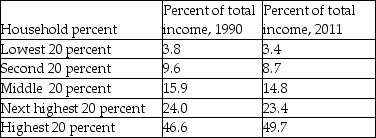
-Using the table provided above to construct Lorenz curves representing 1990 and 2011, what do you discover and how is this interpreted?
A) The Lorenz curve for 1990 is further away from the line of equality than the curve for 2011. This means that inequality is decreasing.
B) The Lorenz curve for 1990 is further away from the line of equality than the curve for 2011. This means that inequality is increasing.
C) The Lorenz curve for 2011 is further away from the line of equality than the curve for 1990. This means that inequality is increasing.
D) The Lorenz curve for 2011 is further away from the line of equality than the curve for 1990. This means that inequality is decreasing.
Correct Answer:

Verified
Correct Answer:
Verified
Q249: The public education system is an example
Q250: <img src="https://d2lvgg3v3hfg70.cloudfront.net/TB8586/.jpg" alt=" -The big
Q251: If income is equally distributed, the Gini
Q252: The federal income tax in the United
Q253: <img src="https://d2lvgg3v3hfg70.cloudfront.net/TB8586/.jpg" alt=" -The figure shows
Q255: The biggest single factor affecting household income
Q256: <img src="https://d2lvgg3v3hfg70.cloudfront.net/TB8586/.jpg" alt=" -In the figure
Q257: Unemployment compensation is an example of<br>A) a
Q258: Wealth differs from income in that<br>A) income
Q259: Describe the effect education and training have