Multiple Choice
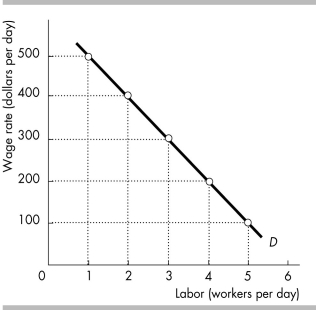
-The figure above shows a local lawn cutting service's demand for labor curve when the price of cutting an acre of lawn is $50 per acre. If the wage rate rises from $100 per day to $200 per day, the firm's demand for labor curve
A) shifts leftward.
B) shifts rightward.
C) does not shift at all, but the firm moves upward along the curve.
D) None of the above because this change shifts the supply of labor curve.
Correct Answer:

Verified
Correct Answer:
Verified
Q332: An increase in the price of a
Q333: If a union is able to decrease
Q334: If the interest rate falls, the present
Q335: <img src="https://d2lvgg3v3hfg70.cloudfront.net/TB8586/.jpg" alt=" -Hank's Propane Storage
Q336: If a firm finds that, at its
Q338: <img src="https://d2lvgg3v3hfg70.cloudfront.net/TB8586/.jpg" alt=" -The above figure
Q339: A company is considering the purchase or
Q340: The supply of land is<br>A) perfectly elastic.<br>B)
Q341: What is the value of marginal product
Q342: As the quantity of labor employed by