menu-iconExamlexExamLexServices

Discover

Ask a Question
  1. All Topics
  2. Topic
    Business
  3. Study Set
    Economics-Microeconomics
  4. Exam
    Exam 18: Markets for Factors of Production
  5. Question
    -In the Above Figure, Which Curve Depicts the Supply of Land
Solved

-In the Above Figure, Which Curve Depicts the Supply of Land

Question 114

Question 114

Multiple Choice

  -In the above figure, which curve depicts the supply of land for Chicago's  Magnificent Mile ? A)  curve F B)  curve G C)  curve H D)  curve I
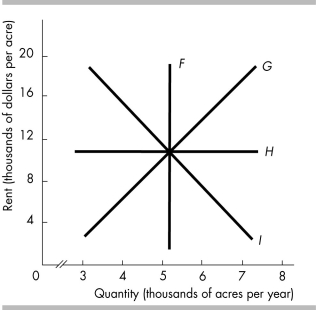
-In the above figure, which curve depicts the supply of land for Chicago's "Magnificent Mile"?


A) curve F
B) curve G
C) curve H
D) curve I

Correct Answer:

verifed

Verified

Unlock this answer now
Get Access to more Verified Answers free of charge

Related Questions

Q109: If the price of a firm's output

Q110: <img src="https://d2lvgg3v3hfg70.cloudfront.net/TB8586/.jpg" alt=" -In the figure

Q111: <img src="https://d2lvgg3v3hfg70.cloudfront.net/TB8586/.jpg" alt=" -If there is

Q112: Due to a recession, Hostess Bakeries found

Q113: If the wage rate paid in the

Q115: If the value of marginal product of

Q116: The labor supply curve has a positive

Q117: A firm that can sell its output

Q118: The labor supply curve has a<br>A) positive

Q119: Which of the following increases the demand

Examlex

ExamLex

About UsContact UsPerks CenterHomeschoolingTest Prep

Work With Us

Campus RepresentativeInfluencers

Links

FaqPricingChrome Extension

Download The App

Get App StoreGet Google Play

Policies

Privacy PolicyTerms of ServiceHonor CodeCommunity Guidelines

Scan To Download

qr-code

Copyright © (2025) ExamLex LLC.

Privacy PolicyTerms Of ServiceHonor CodeCommunity Guidelines