Multiple Choice
 The figure shows the unregulated market for a pesticide, where S is the supply curve and D is the demand curve. The demand curve is the same as the MSB curve. When factories produce the pesticide, they also create waste, which they dump into a lake on the outskirts of the town. The marginal external cost of the dumped waste is equal to the marginal private cost of producing the pesticide.
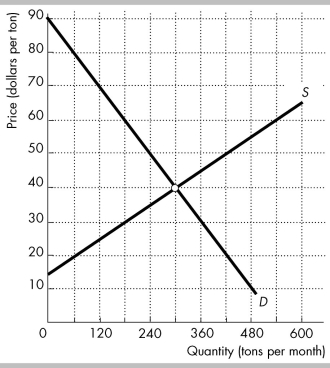
-In the figure above, if no one owns the lake, the market does what?
A) overproduces 120 tons of pesticide
B) underproduces 120 tons of pesticide
C) overproduces 60 tons of pesticide
D) produces the efficient quantity of pesticide
Correct Answer:

Verified
Correct Answer:
Verified
Q31: <img src="https://d2lvgg3v3hfg70.cloudfront.net/TB8586/.jpg" alt=" -The table above
Q32: Does the existence of the University of
Q33: <img src="https://d2lvgg3v3hfg70.cloudfront.net/TB8586/.jpg" alt=" -In the above
Q34: <img src="https://d2lvgg3v3hfg70.cloudfront.net/TB8586/.jpg" alt=" -In the above
Q35: A polluted river has 20 homes on
Q37: <img src="https://d2lvgg3v3hfg70.cloudfront.net/TB8586/.jpg" alt=" -Keeping in mind
Q38: <img src="https://d2lvgg3v3hfg70.cloudfront.net/TB8586/.jpg" alt=" -If the government
Q39: <img src="https://d2lvgg3v3hfg70.cloudfront.net/TB8586/.jpg" alt=" -The table above
Q40: Subsidizing education can lead an efficient level
Q41: Consider an industry that produces an output