Multiple Choice

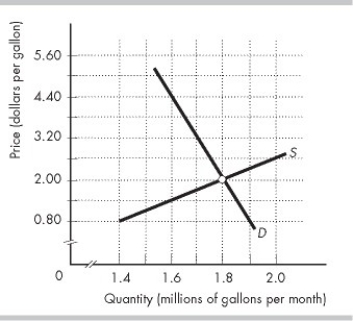
-In the figure above, S is the supply curve and D is the demand curve in the unregulated, competitive market for gasoline in Motorland. The external cost of gasoline is constant at $1.50 per gallon. The efficient quantity of gasoline to sell in Motorland is
A) 1.7 million gallons per month.
B) 1.8 million gallons per month.
C) 1.6 million gallons per month.
D) 1.9 million gallons per month.
Correct Answer:

Verified
Correct Answer:
Verified
Q348: If a local fishing club spends time
Q349: The marginal social cost of burning garbage
Q350: <img src="https://d2lvgg3v3hfg70.cloudfront.net/TB8586/.jpg" alt=" -The above figure
Q351: The cost of producing an additional unit
Q352: <img src="https://d2lvgg3v3hfg70.cloudfront.net/TB8586/.jpg" alt=" -In the above
Q354: The market price of an individual transferable
Q355: An example of an externality occurs when
Q356: The marginal social cost of production is
Q357: The Atlantic City Expressway is a highway
Q358: <img src="https://d2lvgg3v3hfg70.cloudfront.net/TB8586/.jpg" alt=" -A paper mill