Multiple Choice
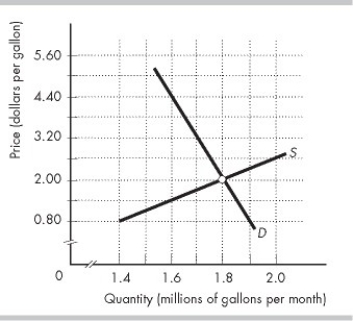
-In the figure above, S is the supply curve and D is the demand curve in the unregulated, competitive market for gasoline in Motorland. The external cost of gasoline is constant at $1.50 per gallon. Suppose Motorland's government imposes a tax of $1.50 per gallon of gasoline sold. With the tax, the market will
A) underproduce by 0.2 million gallons of gasoline a month.
B) underproduce by 0.1 million gallons of gasoline a month.
C) overproduce by 0.1 million gallons of gasoline a month.
D) produce the efficient quantity of gasoline.
Correct Answer:

Verified
Correct Answer:
Verified
Q174: One way to overcome the problem of
Q175: A private cost is a cost of
Q176: The granite boulders in Rocky Mountain National
Q177: <img src="https://d2lvgg3v3hfg70.cloudfront.net/TB8586/.jpg" alt=" The figure shows
Q178: <img src="https://d2lvgg3v3hfg70.cloudfront.net/TB8586/.jpg" alt=" -The figure above
Q180: Marginal social cost is equal to the<br>A)
Q181: All of the following are devices that
Q182: One way of overcoming the problem of
Q183: List and briefly define the three methods
Q184: Producing paper creates pollution. There is no