Multiple Choice
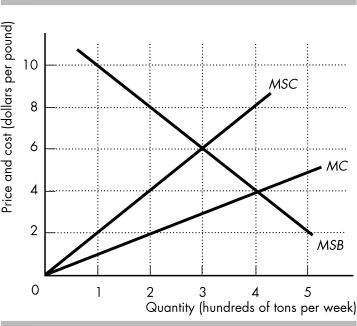
-The above figure shows the marginal private cost curve, marginal social cost curve, and marginal social benefit curve for cod, a common resource. The market equilibrium with no government intervention is
A) 0 tons per week.
B) 400 tons per week.
C) 300 tons per week.
D) None of the above answers is correct.
Correct Answer:

Verified
Correct Answer:
Verified
Q285: "If production of a good creates an
Q286: <img src="https://d2lvgg3v3hfg70.cloudfront.net/TB8586/.jpg" alt=" -In the above
Q287: <img src="https://d2lvgg3v3hfg70.cloudfront.net/TB8586/.jpg" alt=" -The above figure
Q288: Beautification of the national highways through the
Q289: <img src="https://d2lvgg3v3hfg70.cloudfront.net/TB8586/.jpg" alt=" -The table above
Q291: Public universities, by charging tuition _ the
Q292: Which of the following is an example
Q293: <img src="https://d2lvgg3v3hfg70.cloudfront.net/TB8586/.jpg" alt=" -The table above
Q294: <img src="https://d2lvgg3v3hfg70.cloudfront.net/TB8586/.jpg" alt=" -The figure above
Q295: Let MC be the marginal private cost