Multiple Choice
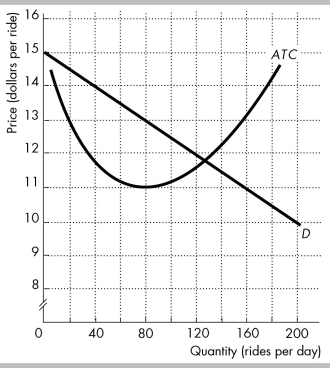 In the figure, D is the demand curve for taxi rides in a town, and ATC is the average total cost curve of a taxi company.
-In an oligopoly market, the Herfindahl-Hirschman Index is usually
A) greater than 2,500.
B) below 1,000.
C) between 100 and 1,000.
D) between 200 and 2,000.
Correct Answer:

Verified
Correct Answer:
Verified
Q34: Which of the following is a distinguishing
Q35: The local banking industry currently has a
Q36: In the prisoners' dilemma game, each player
Q37: Suppose the Herfindahl-Hirschman Index (HHI) in the
Q38: Which of the following is always a
Q40: What is a natural oligopoly? How does
Q41: Price wars are _ likely to occur
Q42: There are two firms that compete against
Q43: <img src="https://d2lvgg3v3hfg70.cloudfront.net/TB8586/.jpg" alt=" -Two students are
Q44: OPEC, the Organization of Petroleum Exporting Countries,