Multiple Choice
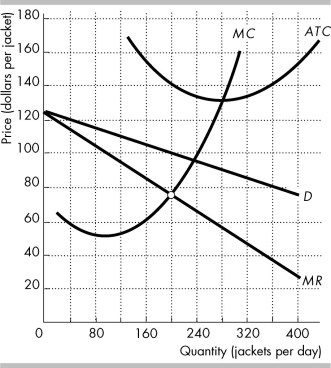 The figure shows the demand curve for Gap jackets (D) , and Gap's marginal revenue curve (MR) , marginal cost curve (MC) , and average total cost curve (ATC) .
-In the figure above, Gap's economic ________ is ________.
A) loss; $8,000
B) loss; $13,000
C) profit; $7,200
D) profit; $13,000
Correct Answer:

Verified
Correct Answer:
Verified
Q168: Advertising by firms in monopolistic competition<br>A) provides
Q169: Under monopolistic competition, firms make zero economic
Q170: In a monopolistically competitive industry<br>A) firms can
Q171: The market for wheat can be described
Q172: Which of the following statements is CORRECT
Q174: <img src="https://d2lvgg3v3hfg70.cloudfront.net/TB8586/.jpg" alt=" -The above figure
Q175: <img src="https://d2lvgg3v3hfg70.cloudfront.net/TB8586/.jpg" alt=" -In the above
Q176: A textbook publisher is in monopolistic competition.
Q177: If a firm spends $600 more on
Q178: Suppose that at one of the Talbot's