Multiple Choice
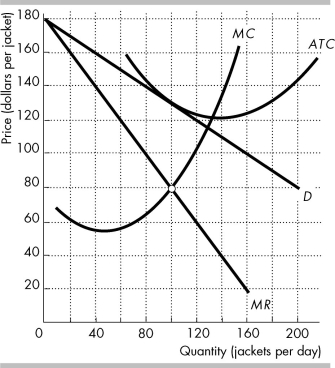 The figure shows the demand curve for Gap jackets (D) , and Gap's marginal revenue curve (MR) , marginal cost curve (MC) , and average total cost curve (ATC) .
-In the figure above, if the market for jackets were perfectly competitive, in long-run equilibrium, each firm would sell ________ jackets per day at ________ per jacket.
A) 132; $122
B) 100; $130
C) 100; $80
D) 128; $114
Correct Answer:

Verified
Correct Answer:
Verified
Q107: <img src="https://d2lvgg3v3hfg70.cloudfront.net/TB8586/.jpg" alt=" -Fresh Taste, Inc.
Q108: Which of the following is NOT true
Q109: A textbook publisher is in monopolistic competition.
Q110: A product that is a close substitute
Q111: A monopolistically competitive industry has<br>A) significant barriers
Q113: Monopolistic competition is a market structure in
Q114: What type of profit can a firm
Q115: Monopolistic competition is a market structure in
Q116: <img src="https://d2lvgg3v3hfg70.cloudfront.net/TB8586/.jpg" alt=" The figure shows
Q117: In the long run, monopolistically competitive firms