Multiple Choice
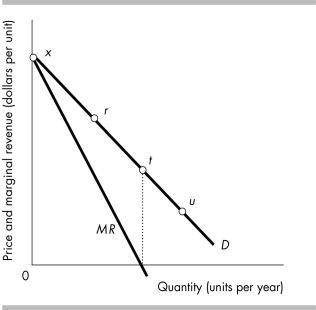
-The figure above shows a monopoly firm's demand curve. If the price and quantity of haircuts move from point t to point r, the monopoly's
A) total revenue will rise.
B) total revenue will fall.
C) total revenue will remain the same.
D) marginal revenue will decrease.
Correct Answer:

Verified
Correct Answer:
Verified
Q416: What condition must exist for a monopolist
Q417: A single-price monopoly will set its price
Q418: <img src="https://d2lvgg3v3hfg70.cloudfront.net/TB8586/.jpg" alt=" -Interlace, Inc. produces
Q419: Compared to a single-price monopoly, the output
Q420: Before summer 2008, if you wanted a
Q422: Rate of return regulation is typically imposed
Q423: Compared to a similar perfectly competitive industry,
Q424: Explain how a single-price monopoly determines its
Q425: When a person lobbies Congress to grant
Q426: <img src="https://d2lvgg3v3hfg70.cloudfront.net/TB8586/.jpg" alt=" -Donna owns the