Multiple Choice
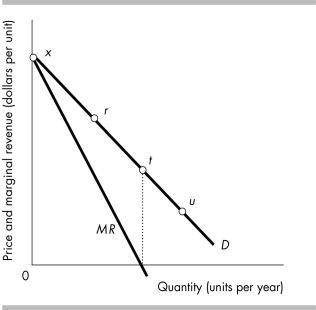
-The figure above shows a monopoly firm's demand curve. The monopoly's total revenue is zero at point
A) x.
B) r.
C) t.
D) u.
Correct Answer:

Verified
Correct Answer:
Verified
Related Questions
Q506: A single-price monopoly charges the same price<br>A)
Q507: Before summer 2008, if you wanted a
Q508: Which of the following is ALWAYS true
Q509: Which of the following can create a
Q510: <img src="https://d2lvgg3v3hfg70.cloudfront.net/TB8586/.jpg" alt=" -The figure above
Q512: <img src="https://d2lvgg3v3hfg70.cloudfront.net/TB8586/.jpg" alt=" -The figure above
Q513: How can managers of natural monopolies exaggerate
Q514: If a natural monopoly is allowed to
Q515: What is price discrimination? Give examples of
Q516: What factor(s) enable a monopoly to make