Multiple Choice
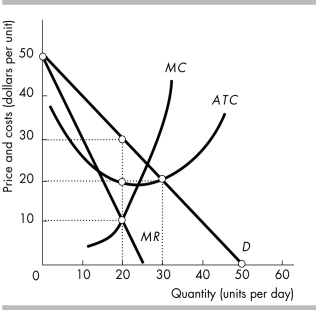
-The figure above shows the demand and cost curves for a single-price monopoly. What economic profit does this firm make?
A) zero
B) $600
C) $400
D) $200
Correct Answer:

Verified
Correct Answer:
Verified
Q475: A single-price monopolist<br>A) sets its price where
Q476: <img src="https://d2lvgg3v3hfg70.cloudfront.net/TB8586/.jpg" alt=" -In the figure
Q477: <img src="https://d2lvgg3v3hfg70.cloudfront.net/TB8586/.jpg" alt=" -The unregulated, single-price
Q478: <img src="https://d2lvgg3v3hfg70.cloudfront.net/TB8586/.jpg" alt=" -An unregulated, single-price
Q479: <img src="https://d2lvgg3v3hfg70.cloudfront.net/TB8586/.jpg" alt=" -Consider the market
Q481: Define price discrimination. What factors must be
Q482: The Public Service Company of Colorado is
Q483: <img src="https://d2lvgg3v3hfg70.cloudfront.net/TB8586/.jpg" alt=" -If an average
Q484: A marginal cost pricing rule for a
Q485: Under rate of return regulation, a regulated