Multiple Choice
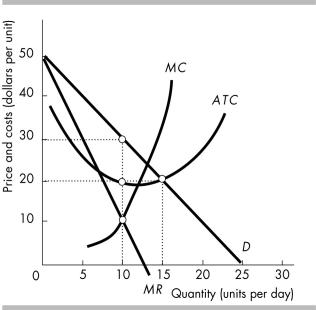
-The figure above shows the demand and cost curves for a single-price monopoly. The firm's economic profit equals
A) $0.
B) $300.
C) $100.
D) $50.
Correct Answer:

Verified
Correct Answer:
Verified
Related Questions
Q317: <img src="https://d2lvgg3v3hfg70.cloudfront.net/TB8586/.jpg" alt=" -Given the market
Q318: A market in which competition and entry
Q319: Suppose a firm is a natural monopoly.
Q320: <img src="https://d2lvgg3v3hfg70.cloudfront.net/TB8586/.jpg" alt=" -The table above
Q321: Suppose that a monopoly is currently producing
Q323: An example of a monopoly is<br>A) a
Q324: "A profit-maximizing monopoly never produces an output
Q325: What is an average cost pricing rule?
Q326: According to social interest theory<br>A) price regulations
Q327: Customers are most likely buying from a