Multiple Choice
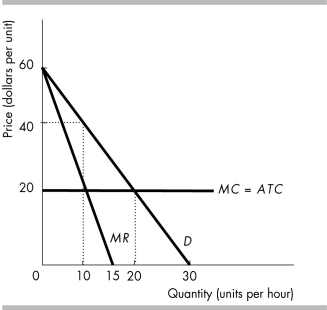
-The above figure shows the demand and cost curves for a monopolist. What is the maximum economic profit this firm can make?
A) zero
B) $400
C) $100
D) $200
Correct Answer:

Verified
Correct Answer:
Verified
Q410: <img src="https://d2lvgg3v3hfg70.cloudfront.net/TB8586/.jpg" alt=" -In the above
Q411: "Price discrimination allows a monopolist to increase
Q412: Patents create monopolies by restricting<br>A) demand.<br>B) prices.<br>C)
Q413: Compare and contrast the marginal cost and
Q414: A monopoly is best defined as a
Q416: What condition must exist for a monopolist
Q417: A single-price monopoly will set its price
Q418: <img src="https://d2lvgg3v3hfg70.cloudfront.net/TB8586/.jpg" alt=" -Interlace, Inc. produces
Q419: Compared to a single-price monopoly, the output
Q420: Before summer 2008, if you wanted a