Multiple Choice
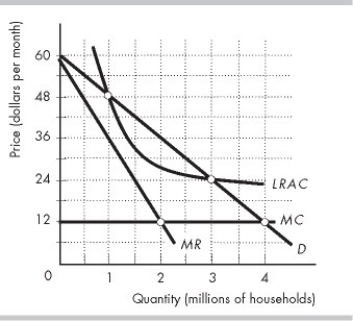
-The figure above shows the demand curve (D) faced by Visual, Inc., a cable TV company, and the firm's marginal revenue (MR) , marginal cost (MC) , and average cost (LRAC) curves. If Visual is regulated according to an average cost pricing rule, there will be
A) a deadweight loss of $6 million per month.
B) a deadweight loss of $24 million per month.
C) a deadweight loss of $12 million per month.
D) no deadweight loss.
Correct Answer:

Verified
Correct Answer:
Verified
Q483: <img src="https://d2lvgg3v3hfg70.cloudfront.net/TB8586/.jpg" alt=" -If an average
Q484: A marginal cost pricing rule for a
Q485: Under rate of return regulation, a regulated
Q486: A monopolist can make an economic profit
Q487: If a monopolist can perfectly price discriminate,
Q489: <img src="https://d2lvgg3v3hfg70.cloudfront.net/TB8586/.jpg" alt=" -The area of
Q490: There is no deadweight loss if the
Q491: <img src="https://d2lvgg3v3hfg70.cloudfront.net/TB8586/.jpg" alt=" -The figure above
Q492: When comparing perfect competition to a single-price
Q493: If a natural monopoly does NOT inflate