Essay
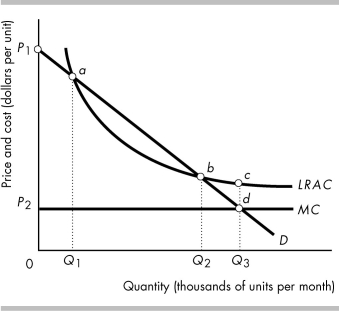
-The above figure represents the cost and demand curves for a natural monopoly that is regulated using a marginal cost pricing rule.
a) What is the quantity?
b) What price is charged?
c) What area represents the consumer surplus when the firm is regulated using a marginal cost pricing rule?
d) What distance represents the firm's loss per unit when the firm is regulated using a marginal cost pricing rule?
Correct Answer:

Verified
a) The quantity is the efficient quantit...View Answer
Unlock this answer now
Get Access to more Verified Answers free of charge
Correct Answer:
Verified
View Answer
Unlock this answer now
Get Access to more Verified Answers free of charge
Q85: A natural monopoly is a firm that
Q86: When an average cost pricing rule is
Q87: <img src="https://d2lvgg3v3hfg70.cloudfront.net/TB8586/.jpg" alt=" -In the above
Q88: Electric utilities are often considered natural monopolies
Q89: Rate of return regulation is equivalent to<br>A)
Q91: <img src="https://d2lvgg3v3hfg70.cloudfront.net/TB8586/.jpg" alt=" -The above table
Q92: Monopolies can make an economic profit in
Q93: A natural monopoly is defined as<br>A) a
Q94: <img src="https://d2lvgg3v3hfg70.cloudfront.net/TB8586/.jpg" alt=" -Consider the market
Q95: <img src="https://d2lvgg3v3hfg70.cloudfront.net/TB8586/.jpg" alt=" -The unregulated, single-price