Multiple Choice
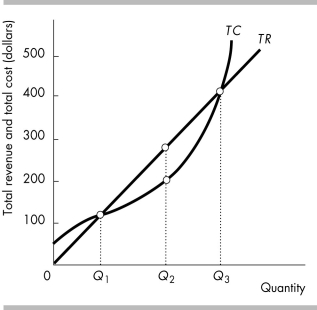
-In the above figure, by increasing its output from Q1 to Q2, the firm
A) reduces its marginal revenue.
B) increases its marginal revenue.
C) decreases its profit.
D) increases its profit.
Correct Answer:

Verified
Correct Answer:
Verified
Q132: A firm that shuts down and produces
Q133: <img src="https://d2lvgg3v3hfg70.cloudfront.net/TB8586/.jpg" alt=" -In the above
Q134: The short-run supply curve for a perfectly
Q135: <img src="https://d2lvgg3v3hfg70.cloudfront.net/TB8586/.jpg" alt=" -The table above
Q136: A worldwide hops (a flower used in
Q138: <img src="https://d2lvgg3v3hfg70.cloudfront.net/TB8586/.jpg" alt=" -In the above
Q139: <img src="https://d2lvgg3v3hfg70.cloudfront.net/TB8586/.jpg" alt=" -The figure illustrates
Q140: The U-pick berry market is perfectly competitive.
Q141: <img src="https://d2lvgg3v3hfg70.cloudfront.net/TB8586/.jpg" alt=" -The table above
Q142: <img src="https://d2lvgg3v3hfg70.cloudfront.net/TB8586/.jpg" alt=" -The table above