Multiple Choice
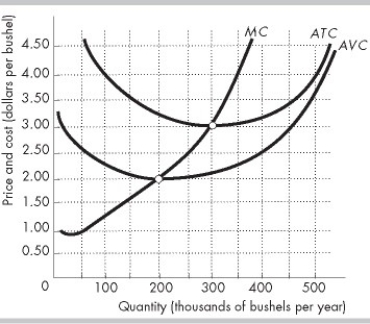
-The figure above shows a typical perfectly competitive corn farm, whose marginal cost curve is MC and average total cost curve is ATC. The market is initially in a long-run equilibrium, where the price is $3.00 per bushel. Then, the market demand for corn decreases and, in the short run, the price falls to $2.50 per bushel. In the new short-run equilibrium, the farm produces ________ bushels of corn and sells corn at ________ per bushel.
A) 250,000; $3.00
B) 250,000; $2.50
C) 300,000; $2.50
D) 200,000; $2.50
Correct Answer:

Verified
Correct Answer:
Verified
Q102: At a firm's break-even point, its<br>A) total
Q103: Fresno County, California is the largest agricultural
Q104: Fresno County, California is the largest agricultural
Q105: A perfectly competitive firm maximizes its economic
Q106: As long as it does NOT shut
Q108: When a firm is considered to be
Q109: Why is the demand for a perfectly
Q110: <img src="https://d2lvgg3v3hfg70.cloudfront.net/TB8586/.jpg" alt=" -The table above
Q111: <img src="https://d2lvgg3v3hfg70.cloudfront.net/TB8586/.jpg" alt=" -Based on the
Q112: John keeps beehives and sells 100 quarts