Multiple Choice
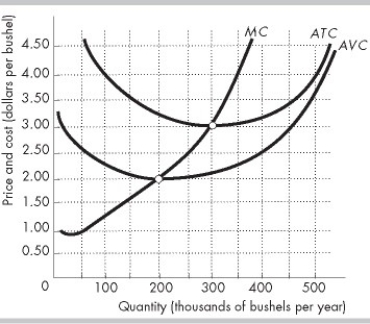
-The figure above shows a typical perfectly competitive corn farm, whose marginal cost curve is MC and average total cost curve is ATC. The market is initially in a long-run equilibrium, where the price is $3.00 per bushel. Then, the market demand for corn decreases and, in the short run, the price falls to $2.50 per bushel. In the new short-run equilibrium, the farm
A) incurs an economic loss of between $1 and $40,000.
B) makes zero economic profit.
C) incurs an economic loss of between $40,001 and $130,000.
D) incurs an economic loss of more than $130,001.
Correct Answer:

Verified
Correct Answer:
Verified
Q58: The difference between a firm's total revenue
Q59: Which of the following is ALWAYS true
Q60: <img src="https://d2lvgg3v3hfg70.cloudfront.net/TB8586/.jpg" alt=" -The figure above
Q61: <img src="https://d2lvgg3v3hfg70.cloudfront.net/TB8586/.jpg" alt=" -The figure above
Q62: <img src="https://d2lvgg3v3hfg70.cloudfront.net/TB8586/.jpg" alt=" -Based on the
Q64: <img src="https://d2lvgg3v3hfg70.cloudfront.net/TB8586/.jpg" alt=" -In the above
Q65: A perfectly competitive firm's economic profit is
Q66: In the long run, a perfectly competitive
Q67: If the market price of a perfectly
Q68: A perfectly competitive firm's short-run supply curve