Multiple Choice
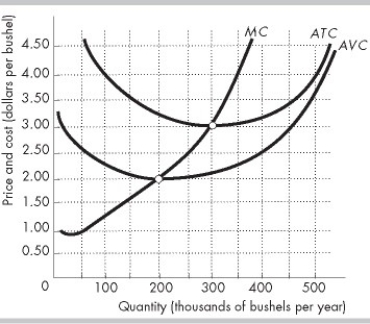
-The figure above shows a typical perfectly competitive corn farm, whose marginal cost curve is MC and average total cost curve is ATC. Assuming there are no changes in technology, in the long run the lowest possible price for corn is ________ per bushel.
A) $2.50
B) $2.00
C) $3.00
D) $3.50
Correct Answer:

Verified
Correct Answer:
Verified
Q461: In the long-run equilibrium in a perfectly
Q462: <img src="https://d2lvgg3v3hfg70.cloudfront.net/TB8586/.jpg" alt=" -Jimmy grows corn.
Q463: <img src="https://d2lvgg3v3hfg70.cloudfront.net/TB8586/.jpg" alt=" -The figure above
Q464: The assumption that a perfectly competitive industry
Q465: Today, firms in a perfectly competitive market
Q467: Entry of new firms into a perfectly
Q468: Why does the profit-maximizing level of production
Q469: The owners will shut down a perfectly
Q470: <img src="https://d2lvgg3v3hfg70.cloudfront.net/TB8586/.jpg" alt=" -The above figure
Q471: Paul runs a shop that sells printers.