Multiple Choice
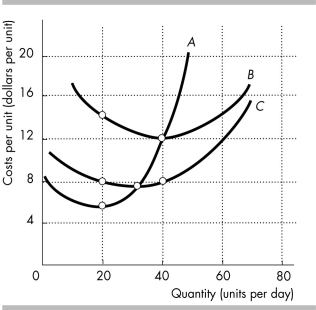
-In the figure above, curve C is the ________ curve.
A) average fixed cost
B) average variable cost
C) average total cost
D) marginal cost
Correct Answer:

Verified
Correct Answer:
Verified
Q233: In the long run, a firm can
Q234: <img src="https://d2lvgg3v3hfg70.cloudfront.net/TB8586/.jpg" alt=" -The table above
Q235: A firm's total product curve shows<br>A) that
Q236: If total fixed cost increases, then the
Q237: If marginal cost exceeds average variable cost
Q239: <img src="https://d2lvgg3v3hfg70.cloudfront.net/TB8586/.jpg" alt=" -The above table
Q240: <img src="https://d2lvgg3v3hfg70.cloudfront.net/TB8586/.jpg" alt=" -In the above
Q241: When a firm experiences economies of scale,
Q242: <img src="https://d2lvgg3v3hfg70.cloudfront.net/TB8586/.jpg" alt=" -The table above
Q243: Pizza Hut<br> <img src="https://d2lvgg3v3hfg70.cloudfront.net/TB8586/.jpg" alt="Pizza Hut