Multiple Choice

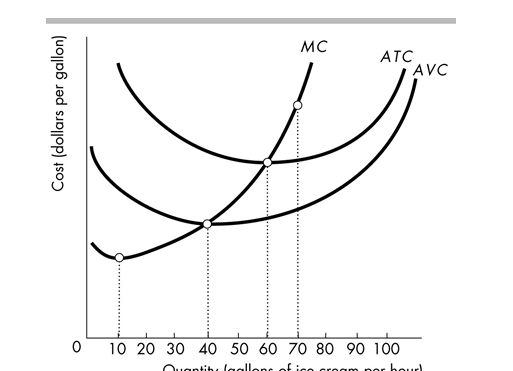
-As illustrated in the above figure, after 60 gallons are produced each hour at Ike's Ice Cream Kitchen, the ATC curve starts to slope upward. The ATC starts to slope upward because the
A) MC curve slopes upward.
B) MC exceeds the ATC.
C) distance between the ATC and the AVC curve is shrinking.
D) None of the above answers is correct.
Correct Answer:

Verified
Correct Answer:
Verified
Q211: What is the law of diminishing returns?
Q212: Which cost always increases as output increases?<br>A)
Q213: As output increases, the slope of the
Q214: Economies of scale refer to<br>A) the point
Q215: Constant returns to scale means that as
Q217: <img src="https://d2lvgg3v3hfg70.cloudfront.net/TB8586/.jpg" alt=" -The above table
Q218: <img src="https://d2lvgg3v3hfg70.cloudfront.net/TB8586/.jpg" alt=" -The above figure
Q219: <img src="https://d2lvgg3v3hfg70.cloudfront.net/TB8586/.jpg" alt=" -Draw an average
Q220: Average variable cost is equal to<br>A) average
Q221: <img src="https://d2lvgg3v3hfg70.cloudfront.net/TB8586/.jpg" alt=" -In the above