Multiple Choice
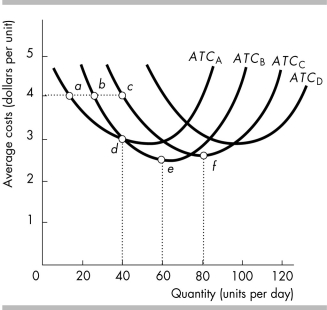
-The average total cost curves for plants A, B, C and D are shown in the above figure. Which plant is best to use to produce 20 units per day?
A) plant A
B) plant B
C) plant C
D) plant D
Correct Answer:

Verified
Correct Answer:
Verified
Q334: Average product equals the<br>A) increase in output
Q335: <img src="https://d2lvgg3v3hfg70.cloudfront.net/TB8586/.jpg" alt=" -The above table
Q336: In general, increasing marginal returns occur<br>A) as
Q337: What is the long-run average cost curve?
Q338: <img src="https://d2lvgg3v3hfg70.cloudfront.net/TB8586/.jpg" alt=" -The above table
Q340: <img src="https://d2lvgg3v3hfg70.cloudfront.net/TB8586/.jpg" alt=" -The average total
Q341: <img src="https://d2lvgg3v3hfg70.cloudfront.net/TB8586/.jpg" alt=" -The above table
Q342: Pat's Catering finds that when it caters
Q343: The law of diminishing returns makes it
Q344: Total Product, Marginal Product, Average Product<br> <img