Multiple Choice
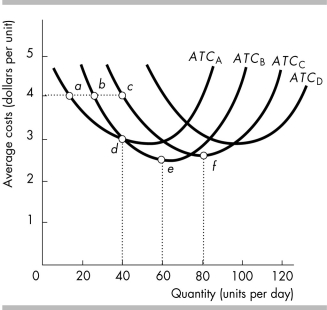
-The average total cost curves for plants A, B, C and D are shown in the above figure. Which plant is best to use to produce 60 units per day?
A) plant A
B) plant B
C) plant C
D) plant D
Correct Answer:

Verified
Correct Answer:
Verified
Q261: When the marginal and average products of
Q262: <img src="https://d2lvgg3v3hfg70.cloudfront.net/TB8586/.jpg" alt=" -Sandra's Sweaters' production
Q263: Minneapolis business Rogue Chocolatier sells specialty chocolate
Q264: <img src="https://d2lvgg3v3hfg70.cloudfront.net/TB8586/.jpg" alt=" -Silvio's Pizza is
Q265: The law of diminishing returns implies that,
Q267: A firm increases both its plant and
Q268: <img src="https://d2lvgg3v3hfg70.cloudfront.net/TB8586/.jpg" alt=" -The above table
Q269: <img src="https://d2lvgg3v3hfg70.cloudfront.net/TB8586/.jpg" alt=" -The above table
Q270: <img src="https://d2lvgg3v3hfg70.cloudfront.net/TB8586/.jpg" alt=" -Silvio's Pizza is
Q271: Diminishing marginal returns occurs when<br>A) all inputs