Multiple Choice
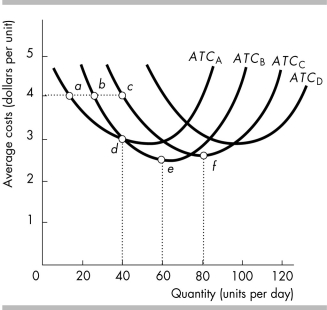
-The average total cost curves for plants A, B, C, and D are shown in the above figure. The plant size that is the most economically efficient
A) is plant A.
B) is plant B.
C) is plant C.
D) depends on the desired level of output.
Correct Answer:

Verified
Correct Answer:
Verified
Q245: <img src="https://d2lvgg3v3hfg70.cloudfront.net/TB8586/.jpg" alt=" -The table above
Q246: Which of the following statements is TRUE?<br>A)
Q247: <img src="https://d2lvgg3v3hfg70.cloudfront.net/TB8586/.jpg" alt=" -In the figure
Q248: A firm's average total cost is $60,
Q249: <img src="https://d2lvgg3v3hfg70.cloudfront.net/TB8586/.jpg" alt=" -In the above
Q251: <img src="https://d2lvgg3v3hfg70.cloudfront.net/TB8586/.jpg" alt=" -The above figure
Q253: <img src="https://d2lvgg3v3hfg70.cloudfront.net/TB8586/.jpg" alt=" -In the above
Q254: A technological change that increases productivity _
Q255: <img src="https://d2lvgg3v3hfg70.cloudfront.net/TB8586/.jpg" alt=" -The above table
Q336: What is the difference between the short