Multiple Choice
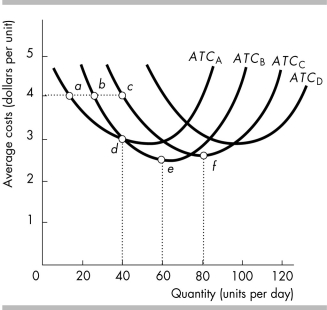
-The average total cost curves for plants A, B, C, and D are shown in the above figure. It is possible that the long-run average cost curve runs through points
A) a, b, and c.
B) b, d, and e.
C) d, e, and f.
D) c and d.
Correct Answer:

Verified
Correct Answer:
Verified
Q388: Cost schedule<br> <img src="https://d2lvgg3v3hfg70.cloudfront.net/TB8586/.jpg" alt="Cost schedule
Q389: Decent Donuts<br> <img src="https://d2lvgg3v3hfg70.cloudfront.net/TB8586/.jpg" alt="Decent Donuts
Q390: When long-run average costs decrease as output
Q391: <img src="https://d2lvgg3v3hfg70.cloudfront.net/TB8586/.jpg" alt=" -Silvio's Pizza is
Q392: If the average total cost of producing
Q394: The output at which average product is
Q395: What are diseconomies of scale and why
Q396: When the average product of labor is
Q397: "In the short run, even when output
Q398: How do the marginal and average products