Multiple Choice
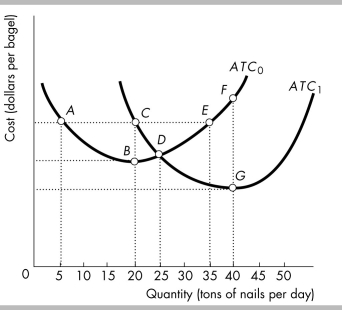
-The average total cost curves for Plant 1, ATC0, and Plant 2, ATC1, are shown in the figure above. Over what range of output is it efficient to operate Plant 1?
A) 0-20
B) 0-25
C) 20-25
D) greater than 25
Correct Answer:

Verified
Correct Answer:
Verified
Q45: The LRAC curve generally is<br>A) shaped as
Q46: Average total cost minus average variable cost
Q47: <img src="https://d2lvgg3v3hfg70.cloudfront.net/TB8586/.jpg" alt=" -Dustin's copy shop
Q48: <img src="https://d2lvgg3v3hfg70.cloudfront.net/TB8586/.jpg" alt=" -The table above
Q49: Pizza Hut<br> <img src="https://d2lvgg3v3hfg70.cloudfront.net/TB8586/.jpg" alt="Pizza Hut
Q51: Which of the following statements regarding the
Q52: Economies of scale refer to the range
Q53: Decent Donuts<br> <img src="https://d2lvgg3v3hfg70.cloudfront.net/TB8586/.jpg" alt="Decent Donuts
Q54: In 2008, Precision Pattern Interiors, which makes
Q55: <img src="https://d2lvgg3v3hfg70.cloudfront.net/TB8586/.jpg" alt=" -In the above