menu-iconExamlexExamLexServices

Discover

Ask a Question
  1. All Topics
  2. Topic
    Business
  3. Study Set
    Economics-Microeconomics
  4. Exam
    Exam 11: Output and Costs
  5. Question
    -The Average Total Cost Curves for Plant 1, ATC<sub>0</sub>, and Plant
Solved

-The Average Total Cost Curves for Plant 1, ATC0, and Plant

Question 438

Question 438

Multiple Choice

  -The average total cost curves for Plant 1, ATC<sub>0</sub>, and Plant 2, ATC<sub>1</sub>, are shown in the figure above. Over what range of output is it efficient to operate Plant 2? A)  0-20 B)  0-25 C)  20-25 D)  greater than 25
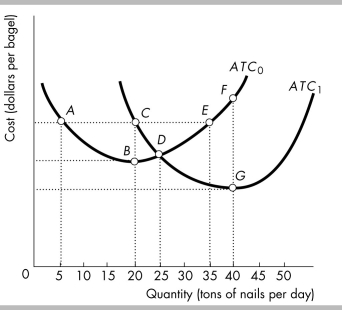
-The average total cost curves for Plant 1, ATC0, and Plant 2, ATC1, are shown in the figure above. Over what range of output is it efficient to operate Plant 2?


A) 0-20
B) 0-25
C) 20-25
D) greater than 25

Correct Answer:

verifed

Verified

Unlock this answer now
Get Access to more Verified Answers free of charge

Related Questions

Q433: The average total cost curve<br>A) is U-shaped.<br>B)

Q434: <img src="https://d2lvgg3v3hfg70.cloudfront.net/TB8586/.jpg" alt=" -The table above

Q435: <img src="https://d2lvgg3v3hfg70.cloudfront.net/TB8586/.jpg" alt=" -In the figure

Q436: "Marginal cost is the increase in total

Q437: What is the relationship between the marginal

Q439: <img src="https://d2lvgg3v3hfg70.cloudfront.net/TB8586/.jpg" alt=" -Jones Production started

Q440: <img src="https://d2lvgg3v3hfg70.cloudfront.net/TB8586/.jpg" alt=" -Based on the

Q441: A change in technology that shifts the

Q442: When marginal cost is greater than average

Q443: The average variable cost curve shifts downward

Examlex

ExamLex

About UsContact UsPerks CenterHomeschoolingTest Prep

Work With Us

Campus RepresentativeInfluencers

Links

FaqPricingChrome Extension

Download The App

Get App StoreGet Google Play

Policies

Privacy PolicyTerms of ServiceHonor CodeCommunity Guidelines

Scan To Download

qr-code

Copyright © (2025) ExamLex LLC.

Privacy PolicyTerms Of ServiceHonor CodeCommunity Guidelines