Multiple Choice
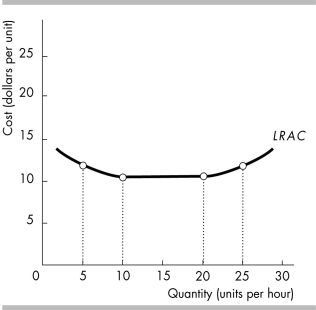
-In the above figure, the long-run average cost curve exhibits diseconomies of scale
A) between 5 and 10 units per hour.
B) between 10 and 20 units per hour.
C) between 20 and 25 units per hour.
D) along the entire curve.
Correct Answer:

Verified
Correct Answer:
Verified
Q476: When the marginal product of labor exceeds
Q477: At that amount of output where diminishing
Q478: Total Product, Marginal Product, Average Product<br> <img
Q479: As output increases, AVC approaches ATC because
Q480: In the long run, total fixed cost
Q482: The vertical distance between a firm's average
Q483: <img src="https://d2lvgg3v3hfg70.cloudfront.net/TB8586/.jpg" alt=" -The cost data
Q484: Are the short-run average total cost curve
Q485: All the production points that lie _
Q486: A decrease in the price of a