Multiple Choice
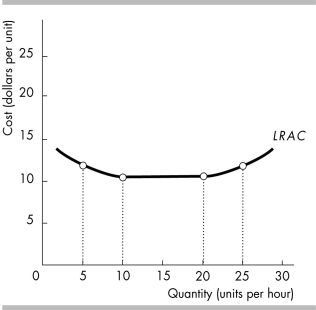
-In the above figure, between 20 and 25 units per hour, the firm experiences
A) economies of scale.
B) diseconomies of scale.
C) constant returns to scale.
D) increasing total fixed costs.
Correct Answer:

Verified
Correct Answer:
Verified
Q295: Describe the relationship between the marginal and
Q296: <img src="https://d2lvgg3v3hfg70.cloudfront.net/TB8586/.jpg" alt=" -Based on the
Q297: In the long run, total variable cost
Q298: <img src="https://d2lvgg3v3hfg70.cloudfront.net/TB8586/.jpg" alt=" -In the above
Q299: <img src="https://d2lvgg3v3hfg70.cloudfront.net/TB8586/.jpg" alt=" -Silvio's Pizza is
Q301: <img src="https://d2lvgg3v3hfg70.cloudfront.net/TB8586/.jpg" alt=" -When long-run average
Q302: A firm's marginal cost is the increase
Q303: Diminishing marginal returns and diseconomies of scale
Q304: <img src="https://d2lvgg3v3hfg70.cloudfront.net/TB8586/.jpg" alt=" -The above figure
Q305: "If the marginal product of labor curve