Multiple Choice
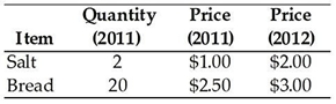
-The data in the table above show the consumption by families in a small (poor) economy. The families consume only salt and bread. The reference base period is 2011. The CPI in 2012 is
A) 100.
B) 18.8
C) 118.8
D) 23.1
E) 123.1
Correct Answer:

Verified
Correct Answer:
Verified
Related Questions
Q46: If the cost of the CPI market
Q47: The CPI market basket<br>A) determines how the
Q48: The difference between nominal and real is<br>A)
Q49: The quality change bias is most likely
Q50: If your real income in base year
Q52: Suppose higher prices lead consumers to switch
Q53: If prices have decreased since the base
Q54: In the current year, the CPI is
Q55: In Australia between 1997and 2018, the<br>A) real
Q56: <img src="https://d2lvgg3v3hfg70.cloudfront.net/TB8401/.jpg" alt=" -Based on the