Multiple Choice
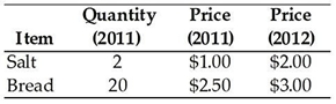
-The data in the table above show the consumption by families in a small (poor) economy. The families consume only salt and bread. The reference base period is 2011. The inflation rate between 2011 and 2012 was
A) 23.1 per cent.
B) 18.8 per cent.
C) 52.5 per cent.
D) 118.8 per cent.
E) 123.1 per cent.
Correct Answer:

Verified
Correct Answer:
Verified
Related Questions
Q13: The CPI market basket is determined by<br>A)
Q14: The formula for the CPI is<br>A) (Cost
Q15: Real GDP is $140 billion and nominal
Q16: A country's CPI was 84.5 last year
Q17: When we compare the records of the
Q19: If the current period has a CPI
Q20: The outlet substitution bias is most likely
Q21: If nominal GDP is $200 billion and
Q22: The Consumer Price Index measures the average
Q23: What good or service is given the