Multiple Choice
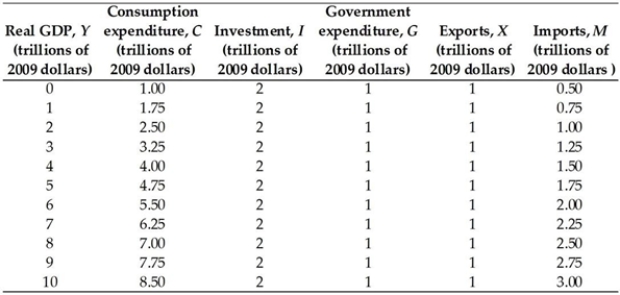
-The table above gives data for the nation of Mosh. If we graphed these data, we would see that when GDP equals
A) $4 trillion, the AE curve intersects the 45° line.
B) $6 trillion, the AE curve is below the 45° line.
C) $9 trillion, the AE curve intersects the 45° line.
D) $10 trillion, the 45° line is above the AE curve.
E) $10 trillion, the AE curve intersects the 45° line.
Correct Answer:

Verified
Correct Answer:
Verified
Q15: <img src="https://d2lvgg3v3hfg70.cloudfront.net/TB8401/.jpg" alt=" -The table above
Q16: In an economy in with no income
Q17: When GDP = $2.5 trillion, C =
Q18: <img src="https://d2lvgg3v3hfg70.cloudfront.net/TB8401/.jpg" alt=" The figure above
Q19: <img src="https://d2lvgg3v3hfg70.cloudfront.net/TB8401/.jpg" alt=" -In the figure
Q21: What is the key difference between the
Q22: <img src="https://d2lvgg3v3hfg70.cloudfront.net/TB8401/.jpg" alt=" -The above table
Q23: If the slope of the aggregate expenditure
Q24: If the MPC is 0.6 and there
Q25: <img src="https://d2lvgg3v3hfg70.cloudfront.net/TB8401/.jpg" alt=" -The table above