Multiple Choice
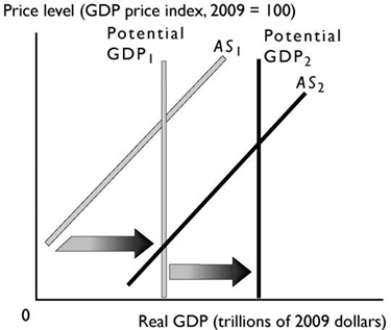
-The change in potential real GDP and aggregate supply shown in the graph above can be a result of
A) a decrease in the money price of oil.
B) an increase in the real wage rate.
C) a fall in the price level.
D) a decrease in the money wage rate.
E) an increase in the quantity of capital.
Correct Answer:

Verified
Correct Answer:
Verified
Q46: <img src="https://d2lvgg3v3hfg70.cloudfront.net/TB8401/.jpg" alt=" -In the figure
Q47: Initially, demand-pull inflation will<br>A) increase the price
Q48: Suppose that the money prices of raw
Q49: <img src="https://d2lvgg3v3hfg70.cloudfront.net/TB8401/.jpg" alt=" -In the figure
Q50: A reason why an increase in the
Q52: Sherri lives in Canada and is considering
Q53: If the aggregate demand curve and the
Q54: If the AD curve shifts rightward while
Q55: A rise in the price level brings
Q56: <img src="https://d2lvgg3v3hfg70.cloudfront.net/TB8401/.jpg" alt=" The table gives