Multiple Choice
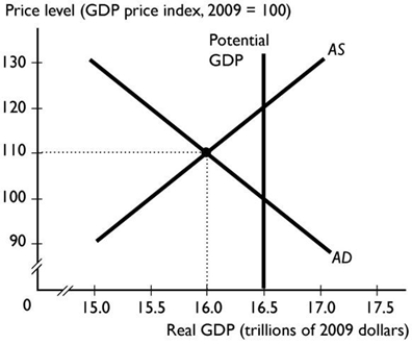
-In the figure above, the economy is at an equilibrium with real GDP of $16 trillion and a price level of 110. As the economy moves toward its ultimate equilibrium, the ________ curve shifts ________ because ________.
A) aggregate supply; rightward; the money wage rate falls
B) potential GDP; leftward; the money wage rate falls
C) aggregate supply; leftward; the money wage rate rises
D) aggregate demand; rightward; the money wage rate falls
E) aggregate demand; leftward; the money wage rate rises
Correct Answer:

Verified
Correct Answer:
Verified
Q62: Along the aggregate supply curve, the quantity
Q63: <img src="https://d2lvgg3v3hfg70.cloudfront.net/TB8401/.jpg" alt=" The table gives
Q64: The aggregate supply curve is a(n) _
Q65: All of the following shift the aggregate
Q66: The aggregate supply curve shifts rightward when<br>A)
Q68: At a price level of 100, John
Q69: <img src="https://d2lvgg3v3hfg70.cloudfront.net/TB8401/.jpg" alt=" -The change reflected
Q70: An increase in the price level leads
Q71: Demand-pull inflation results from continually increasing the
Q72: Which of the following changes aggregate supply