Multiple Choice
The figure below shows the growth curves of two populations of Paramecium,P.aurelia and P.caudatum.From the data,we can conclude that ________. 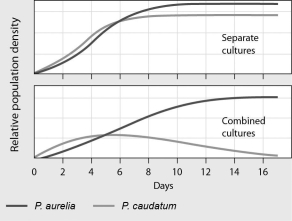
A) the ecological niches of the two species are very different
B) P. aurelia is a predator of P. caudatum
C) P. aurelia and P. caudatum have a mutualistic relationship
D) P. aurelia is the superior competitor in this habitat
Correct Answer:

Verified
Correct Answer:
Verified
Q3: Small areas that have a large number
Q4: In the food chain grass → antelope
Q12: Which type of ecosystem has low primary
Q20: Refer to the following figure.If there were
Q25: <b>Scenario</b><br>In East Java, Indonesia, a mud volcano
Q28: Movement corridors are _.<br>A)always created by humans<br>B)found
Q39: Please refer to the following art to
Q51: The atmosphere is approximately 80% _ gas.<br>A)CO₂<br>B)H₂O<br>C)CH₄<br>D)N₂
Q55: The primary goal of conservation biology is
Q60: Species found in only one place on