Multiple Choice
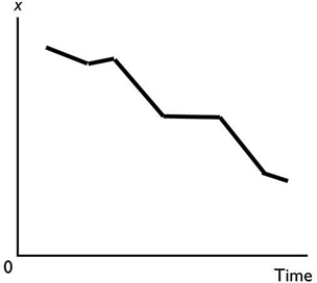 In the above figure, the diagram shows
A) a two-variable scatter diagram.
B) a cross-section graph between x and time.
C) an upward trend in x.
D) a scatter diagram.
E) a downward trend in x.
Correct Answer:

Verified
Correct Answer:
Verified
Related Questions
Q12: John has two hours of free time
Q20: Which type of economic graph reveals trends
Q31: A curve with a positive but decreasing
Q40: Australia has a universal health care system
Q54: An incentive is<br>A) the marginal cost of
Q63: Which of the following statements is correct?<br>A)
Q77: In order to determine whether to major
Q80: Scarcity forces people to:<br>A) cheat and steal.<br>B)
Q94: When Tesla decides to increase production of
Q117: Matt pays a $50 a month membership