Multiple Choice
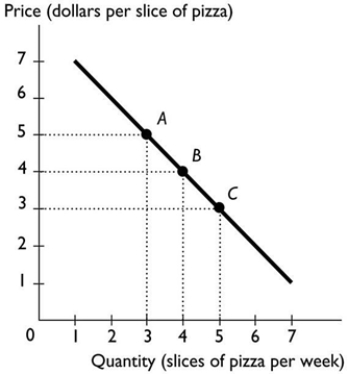
-The above figure shows the relationship between the price of a slice of pizza and how many slices of pizza Ricardo buys in a week. Between points A and B, the slope of the line equals
A) -4.
B) -2
C) -3.
D) -1.
E) -5.
Correct Answer:

Verified
Correct Answer:
Verified
Related Questions
Q5: Proponents of cuts to income tax rates
Q35: The slope of a line equals the
Q52: A statement that 'all children should receive
Q56: Which of the following is a microeconomic
Q60: Because human wants are insatiable and unlimited
Q73: The vertical axis in a graph<br>A) is
Q103: What is NOT true about rational choice?<br>A)
Q108: The _ of something is the gain
Q128: Which of the following is a macroeconomic
Q130: <img src="https://d2lvgg3v3hfg70.cloudfront.net/TB8401/.jpg" alt=" The graph shows